Chronology
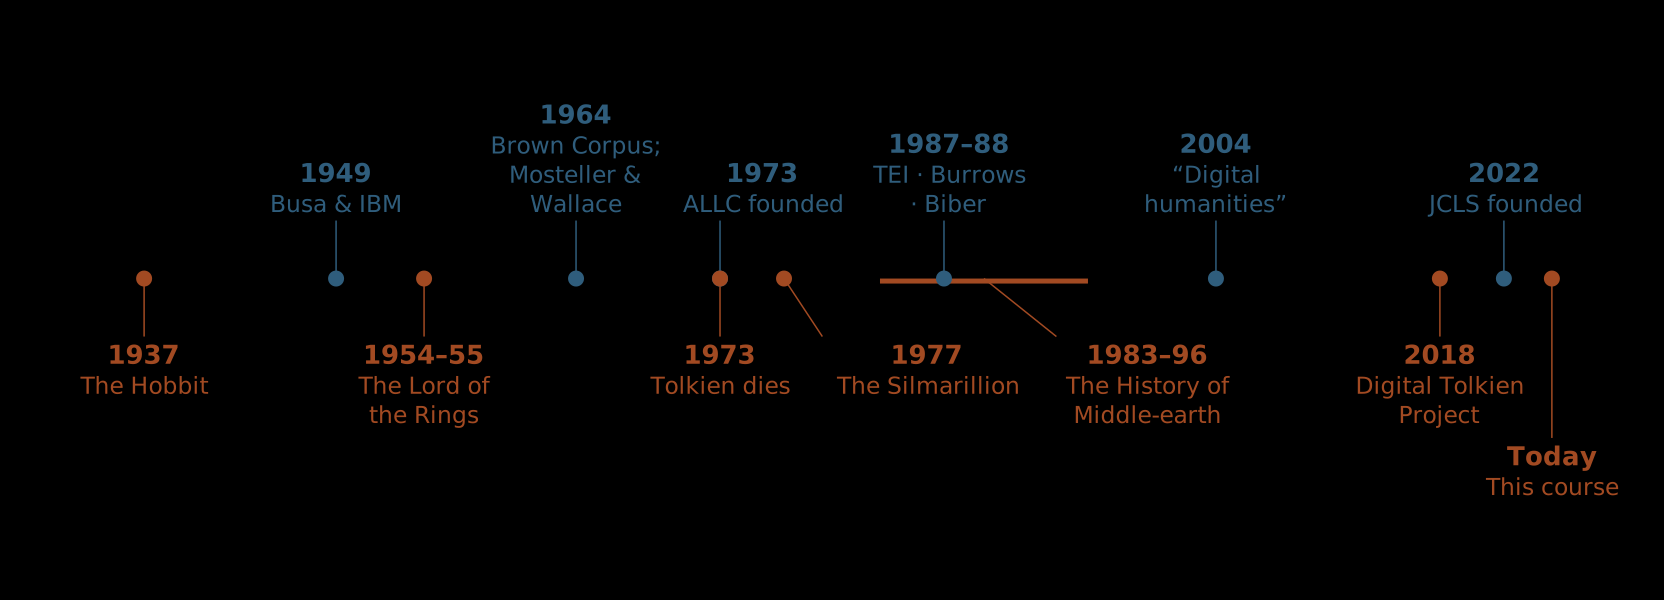
Two timelines on one axis: the history of humanities computing above the line and Tolkien's books below it, from the "two timelines" slide of the Digital Tolkien course's first lecture. A dot is a moment (at), the bar a stretch (start/end); the callouts that would land on one another are moved into the nearest gap, or out to a second level, and their leaders keep them attached. Pinned light, because the colours are the author's and the callouts are written in them.
Result
Source examples/chronology.svgn
<diagram width="1664" height="600" theme="light" padding="0">
<!-- Two timelines on one axis: the history of humanities computing above the
line and Tolkien's books below it, from the "two timelines" slide of the
Digital Tolkien course's first lecture. A dot is a moment (`at`), the bar a
stretch (`start`/`end`); the callouts that would land on one another are
moved into the nearest gap, or out to a second level, and their leaders
keep them attached. Pinned light, because the colours are the author's and
the callouts are written in them. -->
<data name="history">
<record at="1949" side="above" date="1949" what="Busa & IBM"/>
<record at="1964" side="above" date="1964" what="Brown Corpus; Mosteller & Wallace"/>
<record at="1973" side="above" date="1973" what="ALLC founded"/>
<record at="1987" side="above" date="1987–88" what="TEI · Burrows · Biber"/>
<record at="2004" side="above" date="2004" what="“Digital humanities”"/>
<record at="2022" side="above" date="2022" what="JCLS founded"/>
<record at="1937" side="below" date="1937" what="The Hobbit"/>
<record at="1954.5" side="below" date="1954–55" what="The Lord of the Rings"/>
<record at="1973" side="below" date="1973" what="Tolkien dies"/>
<record at="1977" side="below" date="1977" what="The Silmarillion"/>
<record start="1983" end="1996" side="below" date="1983–96" what="The History of Middle-earth"/>
<record at="2018" side="below" date="2018" what="Digital Tolkien Project"/>
<record at="2025" side="below" date="Today" what="This course"/>
</data>
<chronology data="history" from="1930" to="2030" tick="20" width="1664" height="600"
label="date" detail="what" side="side" fill="side"
colors="#2f5d7c, #a24a22" label-size="26" label-width="240"/>
</diagram>