Dashboard
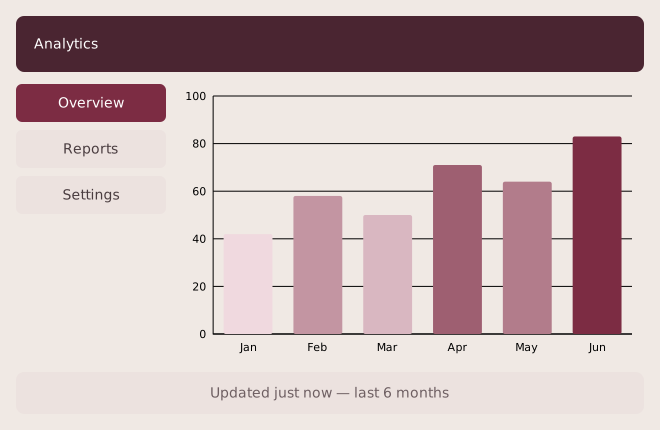
Named grid areas: an "app shell". The areas template paints a picture of the layout; each child places itself into a named region with area="...", and a name repeated across cells spans them (header and footer span both columns). columns="150px 1fr" and rows="56 1fr 42" size the tracks; the 1fr column and row fill. The main region hosts a lazy <plot> that reflows to fill it, and the sidebar a nested stretch column of nav buttons.
Result
Source examples/dashboard.svgn
<diagram width="660" height="430" padding="16" background="#f0e9e4" theme="light">
  <!-- Named grid areas: an "app shell". The `areas` template paints a picture of
       the layout; each child places itself into a named region with `area="..."`,
       and a name repeated across cells spans them (header and footer span both
       columns). columns="150px 1fr" and rows="56 1fr 42" size the tracks; the 1fr
       column and row fill. The main region hosts a lazy <plot> that reflows to
       fill it, and the sidebar a nested stretch column of nav buttons. -->
  <data name="rev">
    <record m="Jan" v="42"/><record m="Feb" v="58"/><record m="Mar" v="50"/>
    <record m="Apr" v="71"/><record m="May" v="64"/><record m="Jun" v="83"/>
  </data>
  <grid columns="150px 1fr" rows="56 1fr 42" gap="12"
        areas="header header / sidebar main / footer footer">
    <box area="header" fill="#4a2531" color="#ffffff" rx="8" text-align="left" padding="18">Analytics</box>
    <column area="sidebar" align="stretch" gap="8">
      <box fill="#7c2c43" color="#ffffff" rx="6">Overview</box>
      <box fill="#ece2df" color="#4a3d40" rx="6">Reports</box>
      <box fill="#ece2df" color="#4a3d40" rx="6">Settings</box>
    </column>
    <plot area="main" data="rev"><bars x="m" y="v" fill="v" colors="#f0d9df #7c2c43"/></plot>
    <box area="footer" fill="#ece2df" color="#6e5f62" rx="8">Updated just now — last 6 months</box>
  </grid>
</diagram>