Kpis
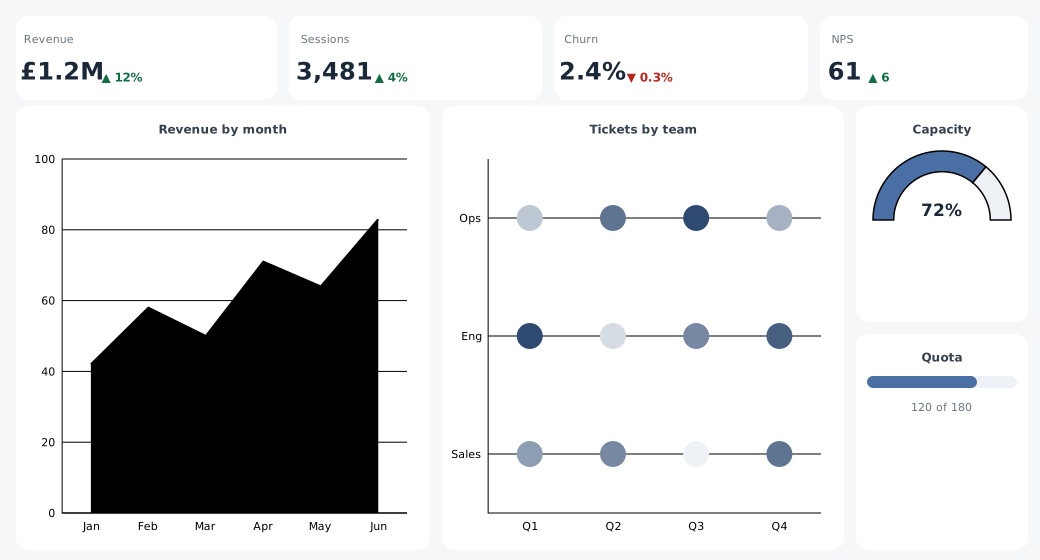
An analytics board, and a check that a dashboard is a composition like anything else here: there is no KPI element, no gauge element and no heatmap element. A tile is a <define> used four times. A gauge is a ring told where to start and when to stop (hole, sweep, start-angle), with the number laid over it by a <stack>; the legend is declined because that number is the key. The matrix is <points> on two bands: x has always had one and y takes one when it names a category. The quota bar is a <stack> whose track fills across with justify="stretch" and whose fill is laid over the start of it. The shell is a <grid> of named areas, as examples/dashboard.svgn shows on its own.
Result
Source examples/kpis.svgn
<diagram width="1040" height="560" padding="16" background="#f6f7f9" theme="light">
  <!-- An analytics board, and a check that a dashboard is a composition like
       anything else here: there is no KPI element, no gauge element and no
       heatmap element.

       A tile is a <define> used four times. A gauge is a ring told where to
       start and when to stop (hole, sweep, start-angle), with the number
       laid over it by a <stack>; the legend is declined because that
       number is the key. The matrix is <points> on two bands: `x` has always had one and `y`
       takes one when it names a category. The quota bar is a <stack> whose track
       fills across with justify="stretch" and whose fill is laid over the start
       of it. The shell is a <grid> of named areas, as examples/dashboard.svgn
       shows on its own. -->
  <style>
    .card  { fill: #ffffff; stroke: #e3e7ed; }
    .kpi   { font-size: 24px; font-weight: 700; fill: #1b2838; }
    .cap   { font-size: 11px; fill: #6b7684; }
    .up    { font-size: 12px; font-weight: 700; fill: #146c43; }
    .down  { font-size: 12px; font-weight: 700; fill: #b3261e; }
    .head  { font-size: 12px; font-weight: 700; fill: #33404d; }
    .track { fill: #eef1f5; stroke: none; }
    .fill  { fill: #4a6fa5; stroke: none; }
    .dial  { font-size: 17px; font-weight: 700; fill: #1b2838; }
  </style>

  <data name="rev">
    <record m="Jan" v="42"/><record m="Feb" v="58"/><record m="Mar" v="50"/>
    <record m="Apr" v="71"/><record m="May" v="64"/><record m="Jun" v="83"/>
  </data>
  <data name="cap"><record k="used" v="72"/><record k="free" v="28"/></data>
  <data name="grid">
    <record team="Ops" q="Q1" v="3"/><record team="Ops" q="Q2" v="7"/>
    <record team="Ops" q="Q3" v="9"/><record team="Ops" q="Q4" v="4"/>
    <record team="Eng" q="Q1" v="9"/><record team="Eng" q="Q2" v="2"/>
    <record team="Eng" q="Q3" v="6"/><record team="Eng" q="Q4" v="8"/>
    <record team="Sales" q="Q1" v="5"/><record team="Sales" q="Q2" v="6"/>
    <record team="Sales" q="Q3" v="1"/><record team="Sales" q="Q4" v="7"/>
  </data>

  <define name="tile" big="" cap="" delta="" tone="up" grow="false">
    <contains class="card" padding="11" gap="2" align="start" grow="${grow}">
      <text class="cap">${cap}</text>
      <row gap="8" align="end">
        <text class="kpi">${big}</text>
        <text class="${tone}">${delta}</text>
      </row>
    </contains>
  </define>

  <grid columns="repeat(4, 1fr)" rows="72 1fr 1fr" gap="12"
        areas="kpis kpis kpis kpis / trend trend grid gauge / trend trend grid quota">
    <row area="kpis" gap="12" align="stretch" justify="space-between">
      <tile big="£1.2M" cap="Revenue"  delta="▲ 12%" grow="true"/>
      <tile big="3,481" cap="Sessions" delta="▲ 4%"  grow="true"/>
      <tile big="2.4%"  cap="Churn"    delta="▼ 0.3%" tone="down" grow="true"/>
      <tile big="61"    cap="NPS"      delta="▲ 6"   grow="true"/>
    </row>

    <contains area="trend" class="card" padding="11" gap="6" align="stretch">
      <text class="head">Revenue by month</text>
      <plot data="rev" grow="true"><area x="m" y="v"/><line x="m" y="v"/></plot>
    </contains>

    <contains area="grid" class="card" padding="11" gap="6" align="stretch">
      <text class="head">Tickets by team</text>
      <plot data="grid" grow="true">
        <points x="q" y="team" fill="v" colors="#eef1f5 #2f4a70" r="13"/>
      </plot>
    </contains>

    <contains area="gauge" class="card" padding="11" gap="4" align="center">
      <text class="head">Capacity</text>
      <stack width="150" height="80" align="end">
        <plot data="cap" coord="polar" hole="0.7" sweep="180" start-angle="-90"
              legend="false" width="150" height="150" align-self="start">
          <bars x="k" y="v" fill="k" colors="#4a6fa5, #eef1f5"/>
        </plot>
        <text class="dial">72%</text>
      </stack>
    </contains>

    <contains area="quota" class="card" padding="11" gap="7" align="stretch">
      <text class="head">Quota</text>
      <stack height="12" justify="stretch">
        <rect class="track" height="12" rx="6"/>
        <rect class="fill" width="110" height="12" rx="6" justify-self="start"/>
      </stack>
      <text class="cap">120 of 180</text>
    </contains>
  </grid>
</diagram>