Mindmap
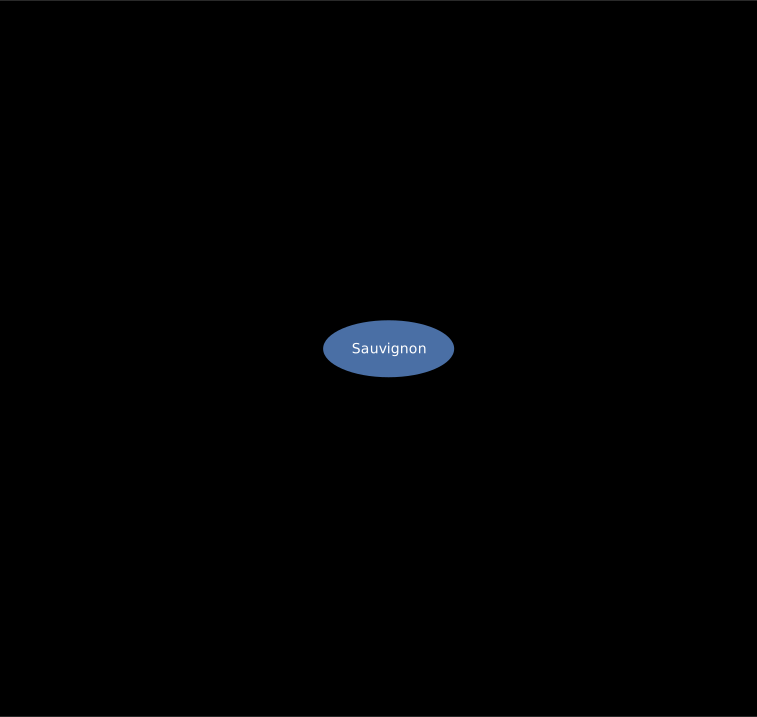
<graph> flows one way, which is right for a process and wrong for a mindmap: a mindmap has a middle and grows outward in every direction at once. <radial> is the same bargain - give it marks and connect them, and it decides where they go - but in rings rather than rows. Each branch takes a wedge in proportion to how many LEAVES it holds, not how many nodes, because leaves are what need room on the rim.
Result
Source examples/mindmap.svgn
<diagram padding="26">
  <!-- <graph> flows one way, which is right for a process and wrong for a
       mindmap: a mindmap has a middle and grows outward in every direction at
       once. <radial> is the same bargain - give it marks and connect them, and
       it decides where they go - but in rings rather than rows.

       Each branch takes a wedge in proportion to how many LEAVES it holds, not
       how many nodes, because leaves are what need room on the rim. -->
  <style>
    .core { fill: #4a6fa5; stroke: #33517a; }
    .core text, text.core { fill: #ffffff; }
  </style>

  <radial gap="20" row-gap="58">
    <ellipse id="root" label="Sauvignon" class="core" color="#ffffff"/>

    <rect id="marks"  label="Marks"/>
    <rect id="lay"    label="Layout"/>
    <rect id="rel"    label="Relations"/>
    <rect id="charts" label="Charts"/>

    <rect id="m1" label="rect"/><rect id="m2" label="diamond"/>
    <rect id="l1" label="row"/><rect id="l2" label="grid"/><rect id="l3" label="graph"/>
    <rect id="r1" label="connect"/><rect id="r2" label="contains"/>
    <rect id="c1" label="plot"/><rect id="c2" label="timeline"/>
  </radial>

  <connect from="root" to="marks"  arrow="none"/>
  <connect from="root" to="lay"    arrow="none"/>
  <connect from="root" to="rel"    arrow="none"/>
  <connect from="root" to="charts" arrow="none"/>

  <connect from="marks"  to="m1" arrow="none"/>
  <connect from="marks"  to="m2" arrow="none"/>
  <connect from="lay"    to="l1" arrow="none"/>
  <connect from="lay"    to="l2" arrow="none"/>
  <connect from="lay"    to="l3" arrow="none"/>
  <connect from="rel"    to="r1" arrow="none"/>
  <connect from="rel"    to="r2" arrow="none"/>
  <connect from="charts" to="c1" arrow="none"/>
  <connect from="charts" to="c2" arrow="none"/>
</diagram>