Pie
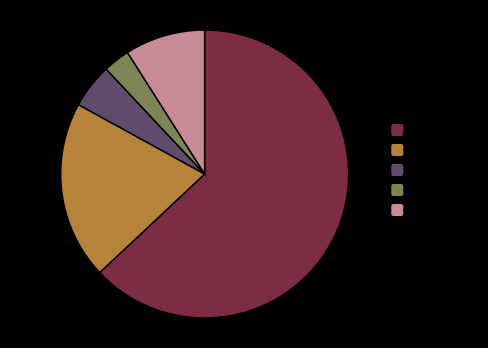
pie = bars + polar. The SAME bars layer, in polar coordinates, becomes a pie: each value is an angular slice, coloured by an ordinal scale, with a legend. "A graphic is a composition, not a type."
Result
Source examples/pie.svgn
<diagram>
  <!-- pie = bars + polar. The SAME bars layer, in polar coordinates, becomes a
       pie: each value is an angular slice, coloured by an ordinal scale, with a
       legend. "A graphic is a composition, not a type." -->
  <data name="browsers">
    <record name="Chrome"  share="63"/>
    <record name="Safari"  share="20"/>
    <record name="Edge"    share="5"/>
    <record name="Firefox" share="3"/>
    <record name="Other"   share="9"/>
  </data>

  <plot data="browsers" coord="polar" width="440" height="300">
    <bars x="name" y="share" colors="#7c2c43, #b5843a, #5f4b6b, #7d8455, #c88a94"/>
  </plot>
</diagram>