Sankey
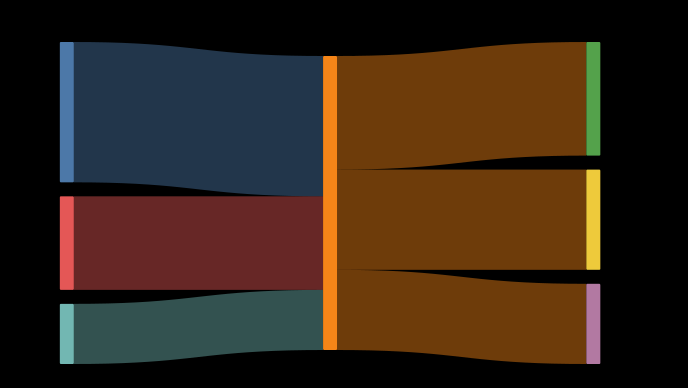
A Sankey is not boxes and arrows with thick lines. Its whole claim is CONSERVATION - a band's width is its value, and what arrives at a node leaves it - so the layout is computed from the values rather than drawn. Two bands of equal width are equal quantities wherever they appear, because one scale covers the diagram. Try changing a value: everything downstream re-thickens with it.
Result
Source examples/sankey.svgn
<diagram>
  <!-- A Sankey is not boxes and arrows with thick lines. Its whole claim is
       CONSERVATION - a band's width is its value, and what arrives at a node
       leaves it - so the layout is computed from the values rather than drawn.
       Two bands of equal width are equal quantities wherever they appear,
       because one scale covers the diagram.

       Try changing a value: everything downstream re-thickens with it. -->
  <data name="energy">
    <record from="Coal"        to="Electricity" tw="42"/>
    <record from="Gas"         to="Electricity" tw="28"/>
    <record from="Wind"        to="Electricity" tw="18"/>
    <record from="Electricity" to="Homes"       tw="34"/>
    <record from="Electricity" to="Industry"    tw="30"/>
    <record from="Electricity" to="Losses"      tw="24"/>
  </data>

  <sankey data="energy" source="from" target="to" value="tw"
          width="640" height="340"/>
</diagram>