Sections
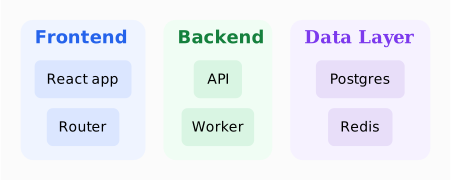
Styled <contains> titles: a boundary title now takes the same text styling as a mark (font-size, font-weight, color, font-family/style), so each section gets a prominent, colour-matched heading. Before, every title was the fixed default (13px grey). color= sets the title colour, fill= the panel; a bigger font-size also reserves the right title height.
Result
Source examples/sections.svgn
<diagram padding="20" background="#fbfbfb" theme="light">
  <!-- Styled <contains> titles: a boundary title now takes the same text styling
       as a mark (font-size, font-weight, color, font-family/style), so each section
       gets a prominent, colour-matched heading. Before, every title was the fixed
       default (13px grey). `color=` sets the title colour, `fill=` the panel; a
       bigger `font-size` also reserves the right title height. -->
  <row gap="18" align="start">
    <contains label="Frontend" color="#2563eb" font-size="18" font-weight="700"
              fill="#eff4ff" stroke="#c7d7fe" padding="14" gap="10">
      <rect fill="#dbe6ff">React app</rect>
      <rect fill="#dbe6ff">Router</rect>
    </contains>
    <contains label="Backend" color="#15803d" font-size="18" font-weight="700"
              fill="#f0fdf4" stroke="#bbf7d0" padding="14" gap="10">
      <rect fill="#d9f5e3">API</rect>
      <rect fill="#d9f5e3">Worker</rect>
    </contains>
    <contains label="Data Layer" color="#7c3aed" font-family="Georgia, serif"
              font-style="italic" font-size="18" fill="#f6f2ff" stroke="#ddd0fb"
              padding="14" gap="10">
      <rect fill="#e8def9">Postgres</rect>
      <rect fill="#e8def9">Redis</rect>
    </contains>
  </row>
</diagram>