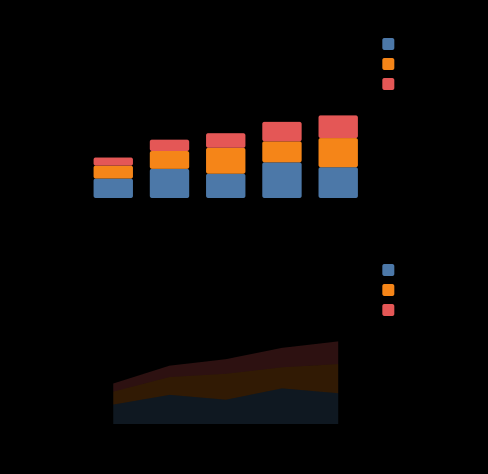
Stacked
Stacking is a POSITION ADJUSTMENT - a component of the grammar beside the mark and the frame, not an option belonging to bars. So it is spelled the same on every layer, and it meets every coordinate frame. Which is why the README's line finally describes the language rather than gesturing at it: a pie IS polar x bars x stack, and asking for the other reading in polar names the chart you would get (a coxcomb) instead of being quietly ignored. Grouped answers "how do the teams compare this month?"; stacked answers "how big was the month, and who made it up?"
Result
Source examples/stacked.svgn
<diagram>
  <!-- Stacking is a POSITION ADJUSTMENT - a component of the grammar beside the
       mark and the frame, not an option belonging to bars. So it is spelled the
       same on every layer, and it meets every coordinate frame.

       Which is why the README's line finally describes the language rather than
       gesturing at it: a pie IS polar x bars x stack, and asking for the other
       reading in polar names the chart you would get (a coxcomb) instead of
       being quietly ignored.

       Grouped answers "how do the teams compare this month?"; stacked answers
       "how big was the month, and who made it up?" -->
  <data name="shipped">
    <record month="Jan" platform="12" growth="8"  infra="5"/>
    <record month="Feb" platform="18" growth="11" infra="7"/>
    <record month="Mar" platform="15" growth="16" infra="9"/>
    <record month="Apr" platform="22" growth="13" infra="12"/>
    <record month="May" platform="19" growth="18" infra="14"/>
  </data>

  <column gap="26">
    <plot data="shipped" width="440" height="200" y-title="shipped">
      <bars x="month" y="platform growth infra" position="stack"/>
    </plot>
    <plot data="shipped" width="440" height="200" y-title="shipped">
      <area x="month" y="platform growth infra" position="stack"/>
    </plot>
  </column>
</diagram>