Autograph
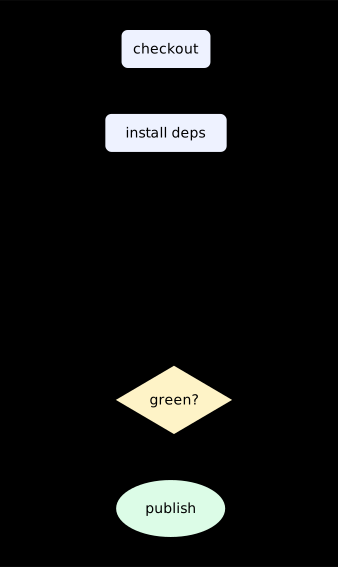
<graph> is the one combinator that decides for you. Nothing below says where anything goes: the rows, the order within each row, and the straight spine down the middle are all read off the <connect> elements, by the same Sugiyama recipe Graphviz's dot runs. Compare with flowchart, which draws a similar shape by stating it — a <column> of <row>s. Both are legitimate. A shape you know is clearer stated; one that falls out of the edges, or that changes when the edges do, is better computed. Note lint and unit share a row because they share a predecessor, and report sits under both because it depends on both — a diamond nobody laid out.
Result
Source examples/autograph.svgn
<diagram padding="30" theme="light">
  <!-- `<graph>` is the one combinator that decides *for* you. Nothing below
       says where anything goes: the rows, the order within each row, and the
       straight spine down the middle are all read off the `<connect>`
       elements, by the same Sugiyama recipe Graphviz's `dot` runs.

       Compare with `flowchart`, which draws a similar shape by *stating* it —
       a `<column>` of `<row>`s. Both are legitimate. A shape you know is
       clearer stated; one that falls out of the edges, or that changes when the
       edges do, is better computed.

       Note `lint` and `unit` share a row because they share a predecessor, and
       `report` sits under both because it depends on both — a diamond nobody
       laid out. -->
  <style>
    .src   { fill: #eef2ff; stroke: #6366f1; }
    .gate  { fill: #fef3c7; stroke: #d97706; }
    .out   { fill: #dcfce7; stroke: #16a34a; }
  </style>

  <graph gap="26" row-gap="46">
    <rect    id="checkout" class="src"  label="checkout"/>
    <rect    id="deps"     class="src"  label="install deps"/>
    <rect    id="lint"                  label="lint"/>
    <rect    id="unit"                  label="unit tests"/>
    <rect    id="build"                 label="build"/>
    <diamond id="gate"     class="gate" label="green?"/>
    <rect    id="report"                label="coverage"/>
    <ellipse id="ship"     class="out"  label="publish"/>
  </graph>

  <connect from="checkout" to="deps"/>
  <connect from="deps"     to="lint"/>
  <connect from="deps"     to="unit"/>
  <connect from="deps"     to="build"/>
  <connect from="lint"     to="report"/>
  <connect from="unit"     to="report"/>
  <connect from="report"   to="gate"/>
  <connect from="build"    to="gate"/>
  <connect from="gate"     to="ship" label="yes"/>
</diagram>