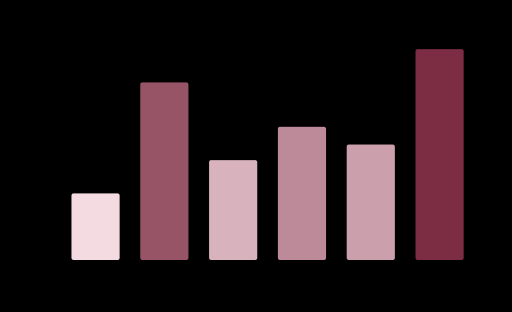
Barchart
A <plot> is a coordinate frame: it owns the scales, draws the axes, and hosts mark layers. fill="amount" colours the bars by a COLOR scale.
Result
Source examples/barchart.svgn
<diagram padding="26">
  <!-- A <plot> is a coordinate frame: it owns the scales, draws the axes, and
       hosts mark layers. `fill="amount"` colours the bars by a COLOR scale. -->
  <data name="sales">
    <record month="Jan" amount="30"/>
    <record month="Feb" amount="80"/>
    <record month="Mar" amount="45"/>
    <record month="Apr" amount="60"/>
    <record month="May" amount="52"/>
    <record month="Jun" amount="95"/>
  </data>

  <plot data="sales" width="460" height="260">
    <bars x="month" y="amount" fill="amount" colors="#f3dbe1 #7c2c43"/>
  </plot>
</diagram>