Fillslide
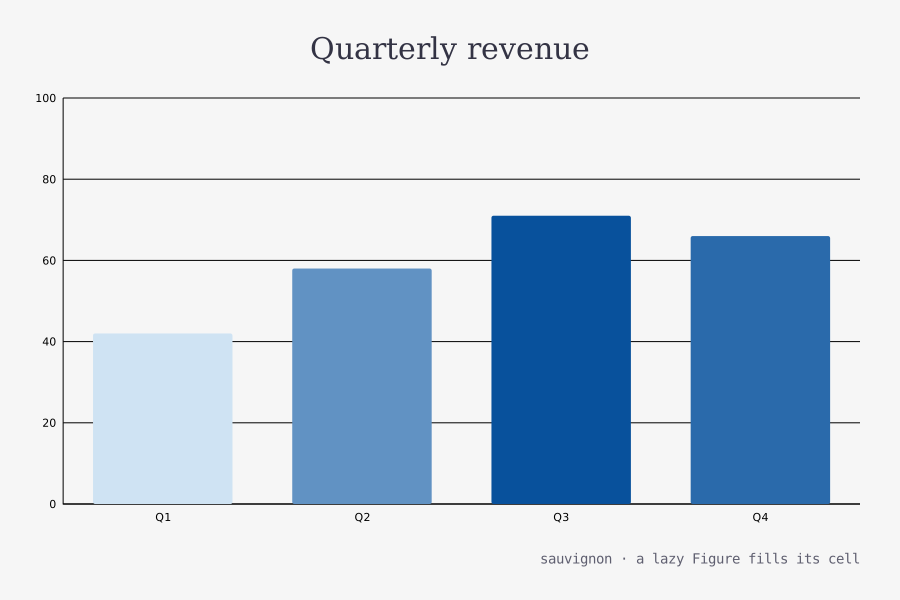
Slice 1 of the layout-models work (docs/layout-models.md): the chart is a LAZY Figure. The column fills the fixed canvas and stretches its children to full width (align="stretch"); the <plot grow> absorbs the leftover height, so the chart reflows to render at 844x444 instead of its 380x240 default. Retires the old space-between hack with a real fill.
Result
Source examples/fillslide.svgn
<diagram width="900" height="600" background="#f6f6f6" theme="light" padding="28">
<!-- Slice 1 of the layout-models work (docs/layout-models.md): the chart is a
LAZY Figure. The column fills the fixed canvas and stretches its children
to full width (align="stretch"); the <plot grow> absorbs the leftover
height, so the chart reflows to render at 844x444 instead of its 380x240
default. Retires the old space-between hack with a real fill. -->
<data name="q">
<record m="Q1" v="42"/>
<record m="Q2" v="58"/>
<record m="Q3" v="71"/>
<record m="Q4" v="66"/>
</data>
<column align="stretch" gap="16">
<text font-size="30" font-family="Georgia, serif" color="#334">Quarterly revenue</text>
<plot data="q" grow="true" axes="true">
<bars x="m" y="v" fill="v"/>
</plot>
<text font-size="14" font-family="monospace" color="#5f5f70"
text-align="right">sauvignon · a lazy Figure fills its cell</text>
</column>
</diagram>