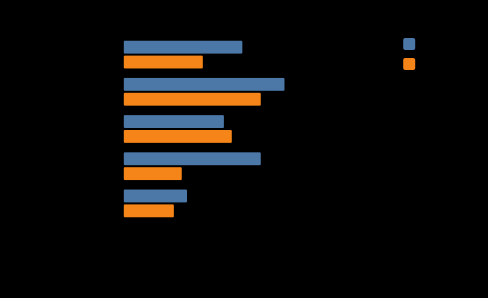
Flipped
A horizontal bar chart is not an option on <bars>. It is flipped times bars, exactly as a pie is polar times bars: the layers do not change, the coordinate frame does. So flipping applies to a line, an area or a scatter just as readily - and to grouped series, as here. The reason to reach for it: long category names. Upright they crowd the axis and tilt; flipped they read straight, in a gutter sized to fit.
Result
Source examples/flipped.svgn
<diagram>
  <!-- A horizontal bar chart is not an option on <bars>. It is `flipped` times
       bars, exactly as a pie is `polar` times bars: the layers do not change,
       the coordinate frame does. So flipping applies to a line, an area or a
       scatter just as readily - and to grouped series, as here.

       The reason to reach for it: long category names. Upright they crowd the
       axis and tilt; flipped they read straight, in a gutter sized to fit. -->
  <data name="langs">
    <record lang="Python"      loc="45" tests="30"/>
    <record lang="Rust"        loc="61" tests="52"/>
    <record lang="Go"          loc="38" tests="41"/>
    <record lang="TypeScript"  loc="52" tests="22"/>
    <record lang="Elixir"      loc="24" tests="19"/>
  </data>

  <plot data="langs" coord="flipped" width="440" height="250"
        x-title="language" y-title="thousands of lines">
    <bars x="lang" y="loc tests"/>
  </plot>
</diagram>