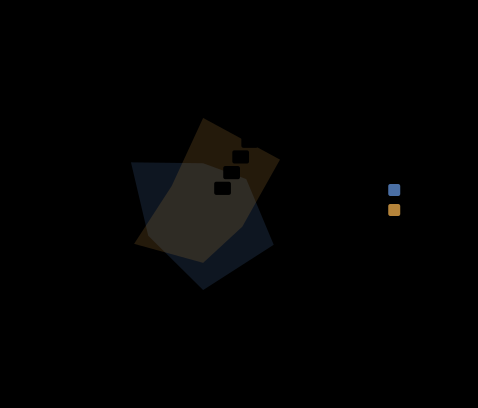
Radar
A radar is the same idea as a pie, one layer along. Bars in polar read the value as an ANGLE and you get a pie; a line or an area reads it as a RADIUS along one of the spokes and you get a radar. The rows are the spokes, and several y fields are several overlaid shapes. "A graphic is a composition, not a type" - neither of these is a chart kind, they are the coordinate frame times the layer.
Result
Source examples/radar.svgn
<diagram>
  <!-- A radar is the same idea as a pie, one layer along. Bars in polar read
       the value as an ANGLE and you get a pie; a line or an area reads it as a
       RADIUS along one of the spokes and you get a radar. The rows are the
       spokes, and several y fields are several overlaid shapes.

       "A graphic is a composition, not a type" - neither of these is a chart
       kind, they are the coordinate frame times the layer. -->
  <data name="languages">
    <record trait="Speed"        python="45" rust="95"/>
    <record trait="Safety"       python="55" rust="98"/>
    <record trait="Terseness"    python="90" rust="50"/>
    <record trait="Libraries"    python="95" rust="65"/>
    <record trait="Tooling"      python="70" rust="88"/>
    <record trait="Learnability" python="92" rust="40"/>
  </data>

  <plot data="languages" coord="polar" width="430" height="360" y-max="100">
    <area x="trait" y="python rust" colors="#4a6fa5, #b5843a"/>
  </plot>
</diagram>