Smartart
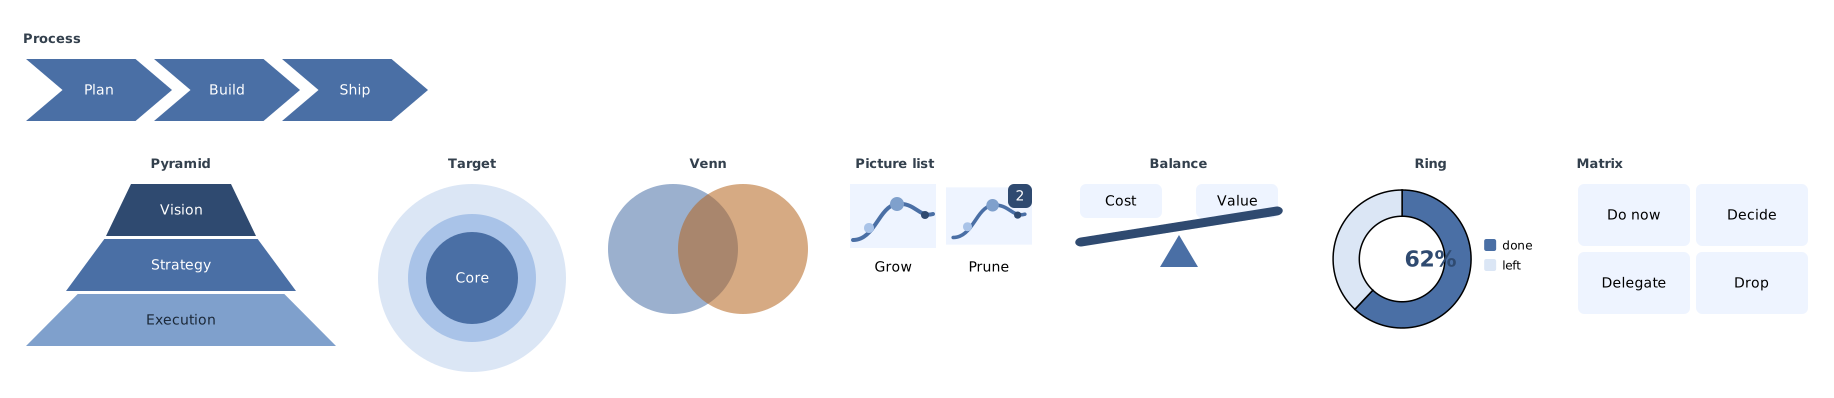
A sheet of the shapes PowerPoint calls SmartArt: a chevron process, a pyramid, a funnel, a Venn, a target and a quadrant matrix. None of them is a diagram type. The chevrons and the pyramid and funnel bands are one <polygon points="...">, which is the whole reason this example exists: sides builds a regular polygon and a chevron is not one, so an arbitrary outline used to be reachable only from Python. The overlaps are a <stack>, the concentric rings are a <stack> of sized circles, and the matrix is a <grid>. A negative gap is what laps one chevron over the next. The picture list is <image>: its href is relative and its bytes are embedded, so this file needs the asset beside it and the compiled SVG needs nothing at all. The badge over the second one is a <stack> putting a mark in a corner of the picture. What is worth copying: a shape you use more than once is a <define>, so the outline is written once and named after what it means.
Result
Source examples/smartart.svgn
<diagram padding="26" theme="light" background="#ffffff">
  <!-- A sheet of the shapes PowerPoint calls SmartArt: a chevron process, a
       pyramid, a funnel, a Venn, a target and a quadrant matrix.

       None of them is a diagram type. The chevrons and the pyramid and funnel
       bands are one <polygon points="...">, which is the whole reason this
       example exists: `sides` builds a regular polygon and a chevron is not one,
       so an arbitrary outline used to be reachable only from Python. The
       overlaps are a <stack>, the concentric rings are a <stack> of sized
       circles, and the matrix is a <grid>. A negative gap is what laps one
       chevron over the next. The picture list is <image>: its href is relative
       and its bytes are embedded, so this file needs the asset beside it and the
       compiled SVG needs nothing at all. The badge over the second one is a
       <stack> putting a mark in a corner of the picture.

       What is worth copying: a shape you use more than once is a <define>, so
       the outline is written once and named after what it means. -->
  <style>
    .step  { fill: #4a6fa5; stroke: #2f4a70; }
    .band1 { fill: #2f4a70; stroke: #24395a; }
    .band2 { fill: #4a6fa5; stroke: #2f4a70; }
    .band3 { fill: #7fa0cc; stroke: #4a6fa5; }
    .ring1 { fill: #dbe6f5; stroke: #7aa3dd; }
    .ring2 { fill: #a9c3e8; stroke: #7aa3dd; }
    .ring3 { fill: #4a6fa5; stroke: #2f4a70; }
    .vennA { fill: #4a6fa5; opacity: 0.55; stroke: none; }
    .vennB { fill: #b5651d; opacity: 0.55; stroke: none; }
    .cell  { fill: #eef4ff; stroke: #7aa3dd; }
    .cap   { font-size: 13px; font-weight: 700; fill: #33404d; }
    .badge { fill: #2f4a70; stroke: #2f4a70; }
    .beam  { fill: #2f4a70; stroke: #2f4a70; }
    .ful   { fill: #4a6fa5; stroke: #2f4a70; }
    .done  { fill: #4a6fa5; stroke: #4a6fa5; }
    .left  { fill: #dbe6f5; stroke: #7aa3dd; }
    .mid   { font-size: 22px; font-weight: 700; fill: #2f4a70; }
    .hub   { fill: #ffffff; stroke: none; }
  </style>

  <!-- the outline, written once and named for what it means -->
  <define name="chevron" text="" tone="step">
    <polygon points="0,0 3,0 4,2 3,4 0,4 1,2" class="${tone}"
             width="146" height="62" color="#ffffff" label="${text}"/>
  </define>
  <define name="band" text="" wide="200" tone="band2" ink="#ffffff">
    <polygon points="1,0 5,0 6,3 0,3" class="${tone}"
             width="${wide}" height="52" color="${ink}" label="${text}"/>
  </define>

  <data name="ring"><record k="done" v="62"/><record k="left" v="38"/></data>

  <column gap="30" align="start">

    <column gap="8" align="start">
      <text class="cap">Process</text>
      <row gap="-18">
        <chevron text="Plan"/>
        <chevron text="Build"/>
        <chevron text="Ship"/>
      </row>
    </column>

    <row gap="42" align="start">
      <column gap="8" align="center">
        <text class="cap">Pyramid</text>
        <column gap="3" align="center">
          <band text="Vision"    wide="150" tone="band1"/>
          <band text="Strategy"  wide="230" tone="band2"/>
          <band text="Execution" wide="310" tone="band3" ink="#1b2838"/>
        </column>
      </column>

      <column gap="8" align="center">
        <text class="cap">Target</text>
        <stack align="center" justify="center">
          <circle class="ring1" width="188" height="188"/>
          <circle class="ring2" width="128" height="128"/>
          <circle class="ring3" width="92" height="92" color="#ffffff">Core</circle>
        </stack>
      </column>

      <column gap="8" align="center">
        <text class="cap">Venn</text>
        <stack width="200" height="130">
          <circle class="vennA" width="130" height="130" justify-self="start"/>
          <circle class="vennB" width="130" height="130" justify-self="end"/>
        </stack>
      </column>

      <column gap="8" align="start">
        <text class="cap">Picture list</text>
        <row gap="10">
          <column gap="6" align="center">
            <image href="assets/vine.svg" width="86" height="64"/>
            <text width="86" text-align="center">Grow</text>
          </column>
          <column gap="6" align="center">
            <stack>
              <image href="assets/vine.svg" width="86" height="64" fit="contain"/>
              <rect class="badge" color="#ffffff" padding="4"
                    justify-self="end" align-self="start">2</rect>
            </stack>
            <text width="86" text-align="center">Prune</text>
          </column>
        </row>
      </column>

      <column gap="8" align="center">
        <text class="cap">Balance</text>
        <column gap="4" align="center">
          <row gap="34" align="end">
            <rect class="cell" width="82" height="34" align-self="start">Cost</rect>
            <rect class="cell" width="82" height="34">Value</rect>
          </row>
          <rect class="beam" rotate="-9" width="210" height="9"/>
          <polygon class="ful" sides="3" width="38" height="32"/>
        </column>
      </column>

      <column gap="8" align="center">
        <text class="cap">Ring</text>
        <stack>
          <plot data="ring" coord="polar" hole="0.62" width="210" height="150">
            <bars x="k" y="v" fill="k" colors="#4a6fa5, #dbe6f5"/>
          </plot>
          <circle class="hub" width="76" height="76"/>
          <text class="mid">62%</text>
        </stack>
      </column>

      <column gap="8" align="start">
        <text class="cap">Matrix</text>
        <grid columns="repeat(2, 1fr)" rows="repeat(2, 62px)" gap="6" width="230">
          <rect class="cell">Do now</rect>
          <rect class="cell">Decide</rect>
          <rect class="cell">Delegate</rect>
          <rect class="cell">Drop</rect>
        </grid>
      </column>
    </row>
  </column>
</diagram>