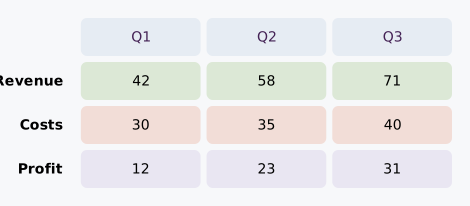
Table
Slice 2 of the layout-models work: a real grid. Columns are "max-content repeat(3, 1fr)": a label column as wide as its widest cell, then three equal fractional columns. Cells share tracks, so every column lines up across rows (a column-of-rows couldn't guarantee that). The 1fr tracks fill because the diagram width makes the grid definite.
Result
Source examples/table.svgn
<diagram width="470" padding="18" background="#f7f8fa" theme="light">
  <!-- Slice 2 of the layout-models work: a real grid. Columns are
       "max-content repeat(3, 1fr)": a label column as wide as its widest cell,
       then three equal fractional columns. Cells share tracks, so every column
       lines up across rows (a column-of-rows couldn't guarantee that). The 1fr
       tracks fill because the diagram width makes the grid definite. -->
  <grid columns="max-content repeat(3, 1fr)" gap="6">
    <text></text>
    <rect fill="#e6ecf3" color="#425">Q1</rect>
    <rect fill="#e6ecf3" color="#425">Q2</rect>
    <rect fill="#e6ecf3" color="#425">Q3</rect>

    <text text-align="right" font-weight="600">Revenue</text>
    <rect fill="#dce8d6">42</rect>
    <rect fill="#dce8d6">58</rect>
    <rect fill="#dce8d6">71</rect>

    <text text-align="right" font-weight="600">Costs</text>
    <rect fill="#f2ddd7">30</rect>
    <rect fill="#f2ddd7">35</rect>
    <rect fill="#f2ddd7">40</rect>

    <text text-align="right" font-weight="600">Profit</text>
    <rect fill="#e9e6f2">12</rect>
    <rect fill="#e9e6f2">23</rect>
    <rect fill="#e9e6f2">31</rect>
  </grid>
</diagram>