← All examples
Proportional
Charts
726 × 343
<bars><column><data><plot><record><row><style><text>
Result
Source examples/proportional.svgn
<diagram padding="20">
  <column gap="16" align="center">
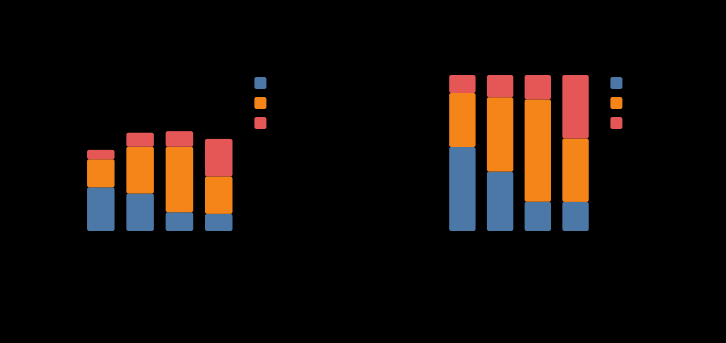
    <text class="title" label="Where the support hours went"/>
    <row gap="26" align="start">
      <plot data="tickets" width="330" height="220" x-title="quarter"
            y-title="hours">
        <bars x="q" y="onboarding bugs billing" position="stack"/>
      </plot>
      <plot data="tickets" width="330" height="220" x-title="quarter"
            y-title="share of quarter">
        <bars x="q" y="onboarding bugs billing" position="fill"/>
      </plot>
    </row>
    <text class="caption"
          label="Same data, same layer: stack answers how big, fill answers what of."/>
  </column>
  <data name="tickets">
    <record q="Q1" onboarding="140" bugs="90"  billing="30"/>
    <record q="Q2" onboarding="120" bugs="150" billing="45"/>
    <record q="Q3" onboarding="60"  bugs="210" billing="50"/>
    <record q="Q4" onboarding="55"  bugs="120" billing="120"/>
  </data>
  <style>
    .title { font-size: 15px; font-weight: 700; fill: var(--sv-title); }
    .caption { font-size: 12px; fill: var(--sv-muted); }
  </style>
</diagram>
Open the SVG →